Financial statement dimensions
XBRL dimensions are powerful but messy—they can clutter your statements with segment breakdowns you didn't ask for. Recent edgartools releases introduce smarter defaults and a new view parameter that lets you choose between summary, standard, and detailed output

There have been a lot of changes in edgartools but one common theme dominated the past 2 weeks. This was the attempt to have the financial statements presented by edgartools match what you will see in the company's filing online. Well you may say this is a minimal expectation of the world's greatest open source SEC filings library and you might be right. But when I started developing against the XBRL spec more than two years ago I never expected it to be this difficult. There is a reason why some companies charge $12000 per year for XBRL features.
That being said the constant flow of Github issues and comments from users means that edgartools is a self correcting vessel meandering towards XBRL truth. We will eventually get there even if the Brownian motion can be a little jarring.
Release 5.7.0: include_dimensions = False
Release 5.7.0 was one of these course corrections. A user reported seeing extra information in the edgartools balance sheet not in the actual filing. This happened because include_dimensions defaulted to False.
I should explain what a dimension is. In XBRL, a dimension is a way to slice financial data along different axes like filters in a spreadsheet. A company might report total revenue of $10 billion, but also break that down by geography (North America: $6B, Europe: $3B, Asia: $1B) or by product line or business segment. Each of these breakdowns is a "dimension."

The problem was when include_dimensions was True by default, users would see both the consolidated total and all the dimensional breakdowns mixed into the same statement. The statement would then look different from what was shown in the actual filing.
Release 5.7.1: Partial reversion
So in 5.7.0 we set include_dimensions to False by default. However this triggered another problem, arguably worse. It so happens that the Statement of Equity and Comprehensive Income statements are inherently dimensional meaning a lot of the values disappeared. So Release 5.7.1 change the default for those two statements to include_dimension=True.
Face vs breakdown dimensions
Following the release I did some research and Opus alerted me to the concept of face vs breakdown dimensions.
Face dimensions are the face of the statement. In a Statement of Stockholders' Equity, the columns showing Common Stock, Additional Paid-in Capital, Retained Earnings, and Treasury Stock aren't "extra" breakdowns—they are the statement. Without them, you just have a single column of totals that makes no sense. Similarly, Comprehensive Income often uses dimensions to separate the components that flow through the income statement versus those that bypass it.

Breakdown dimensions, on the other hand, are the supplementary slices—revenue by geography, assets by segment, expenses by product line. These enrich the data but aren't required to understand the primary statement. They belong in the footnotes, not the face of the financials.
The problem with a simple include_dimensions=True/False flag was that it treated all dimensions the same. Turn it off, and you lose the essential structure of equity statements. Turn it on, and you get segment clutter in your balance sheet. What we really needed was a smarter filter: include face dimensions automatically, exclude breakdown dimensions by default.
Release 5.8.0: The view parameter
This is where the view parameter comes in. Instead of asking users to think about dimensions at all, we now ask a simpler question: what do you want to see?

The view parameter accepts three values: standard, detailed and summary
# Standard view - matches SEC Viewer (default for print)
balance_sheet = filing.xbrl().statements.balance_sheet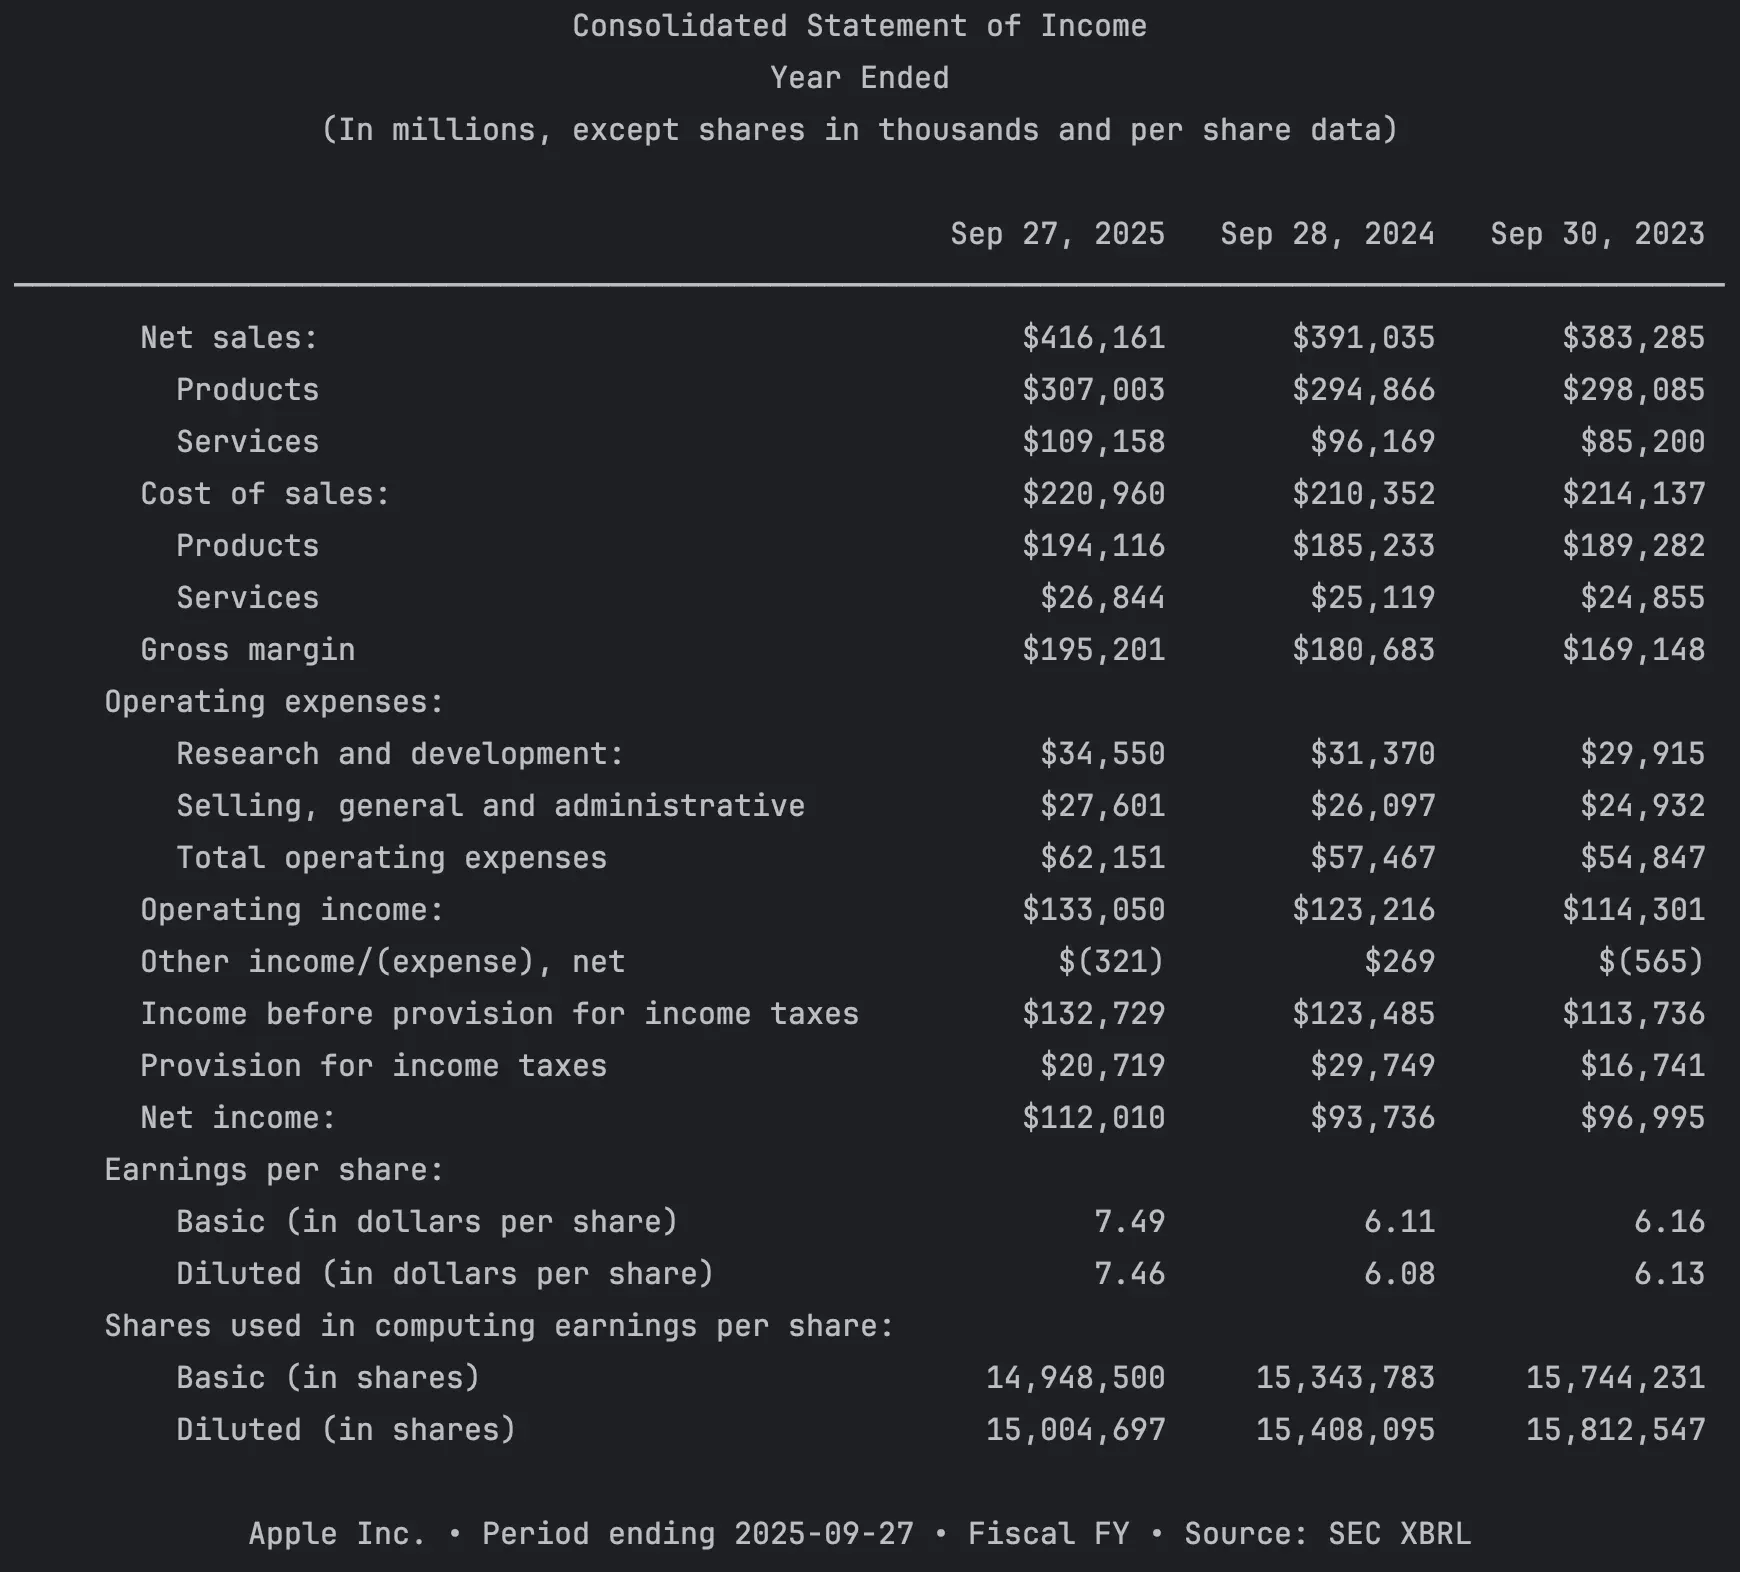
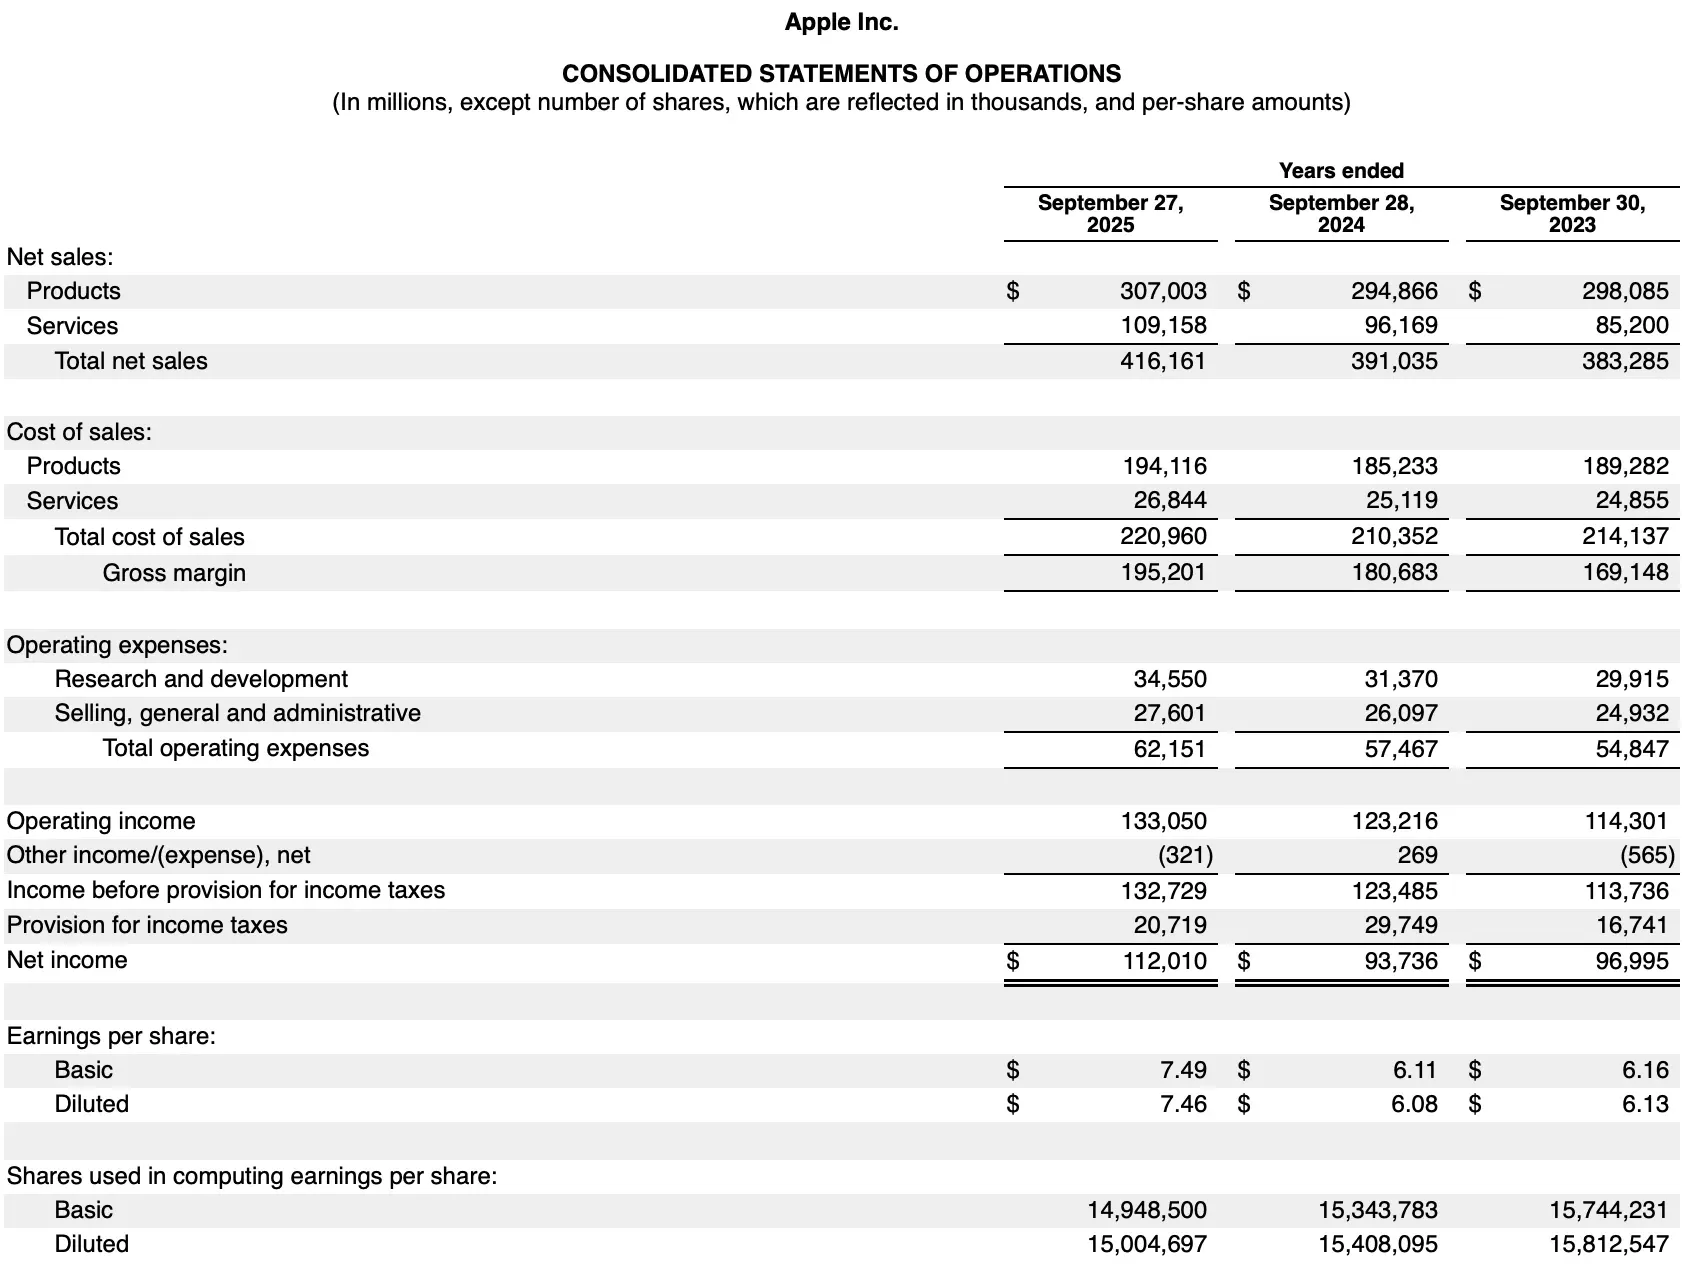
The income statement generated in edgartools now matches the SEC filing (apart from slight placement differences for totals)
- detailed — The full dimensional view. Every slice, every segment, every breakdown the company reported—iPhone, iPad, Mac, Services, the works. This is the default when you call
to_dataframe()because programmatic analysis often needs the granular data.
# Detailed view - all dimensional breakdowns
print(xb.statements.income_statement(view="detailed"))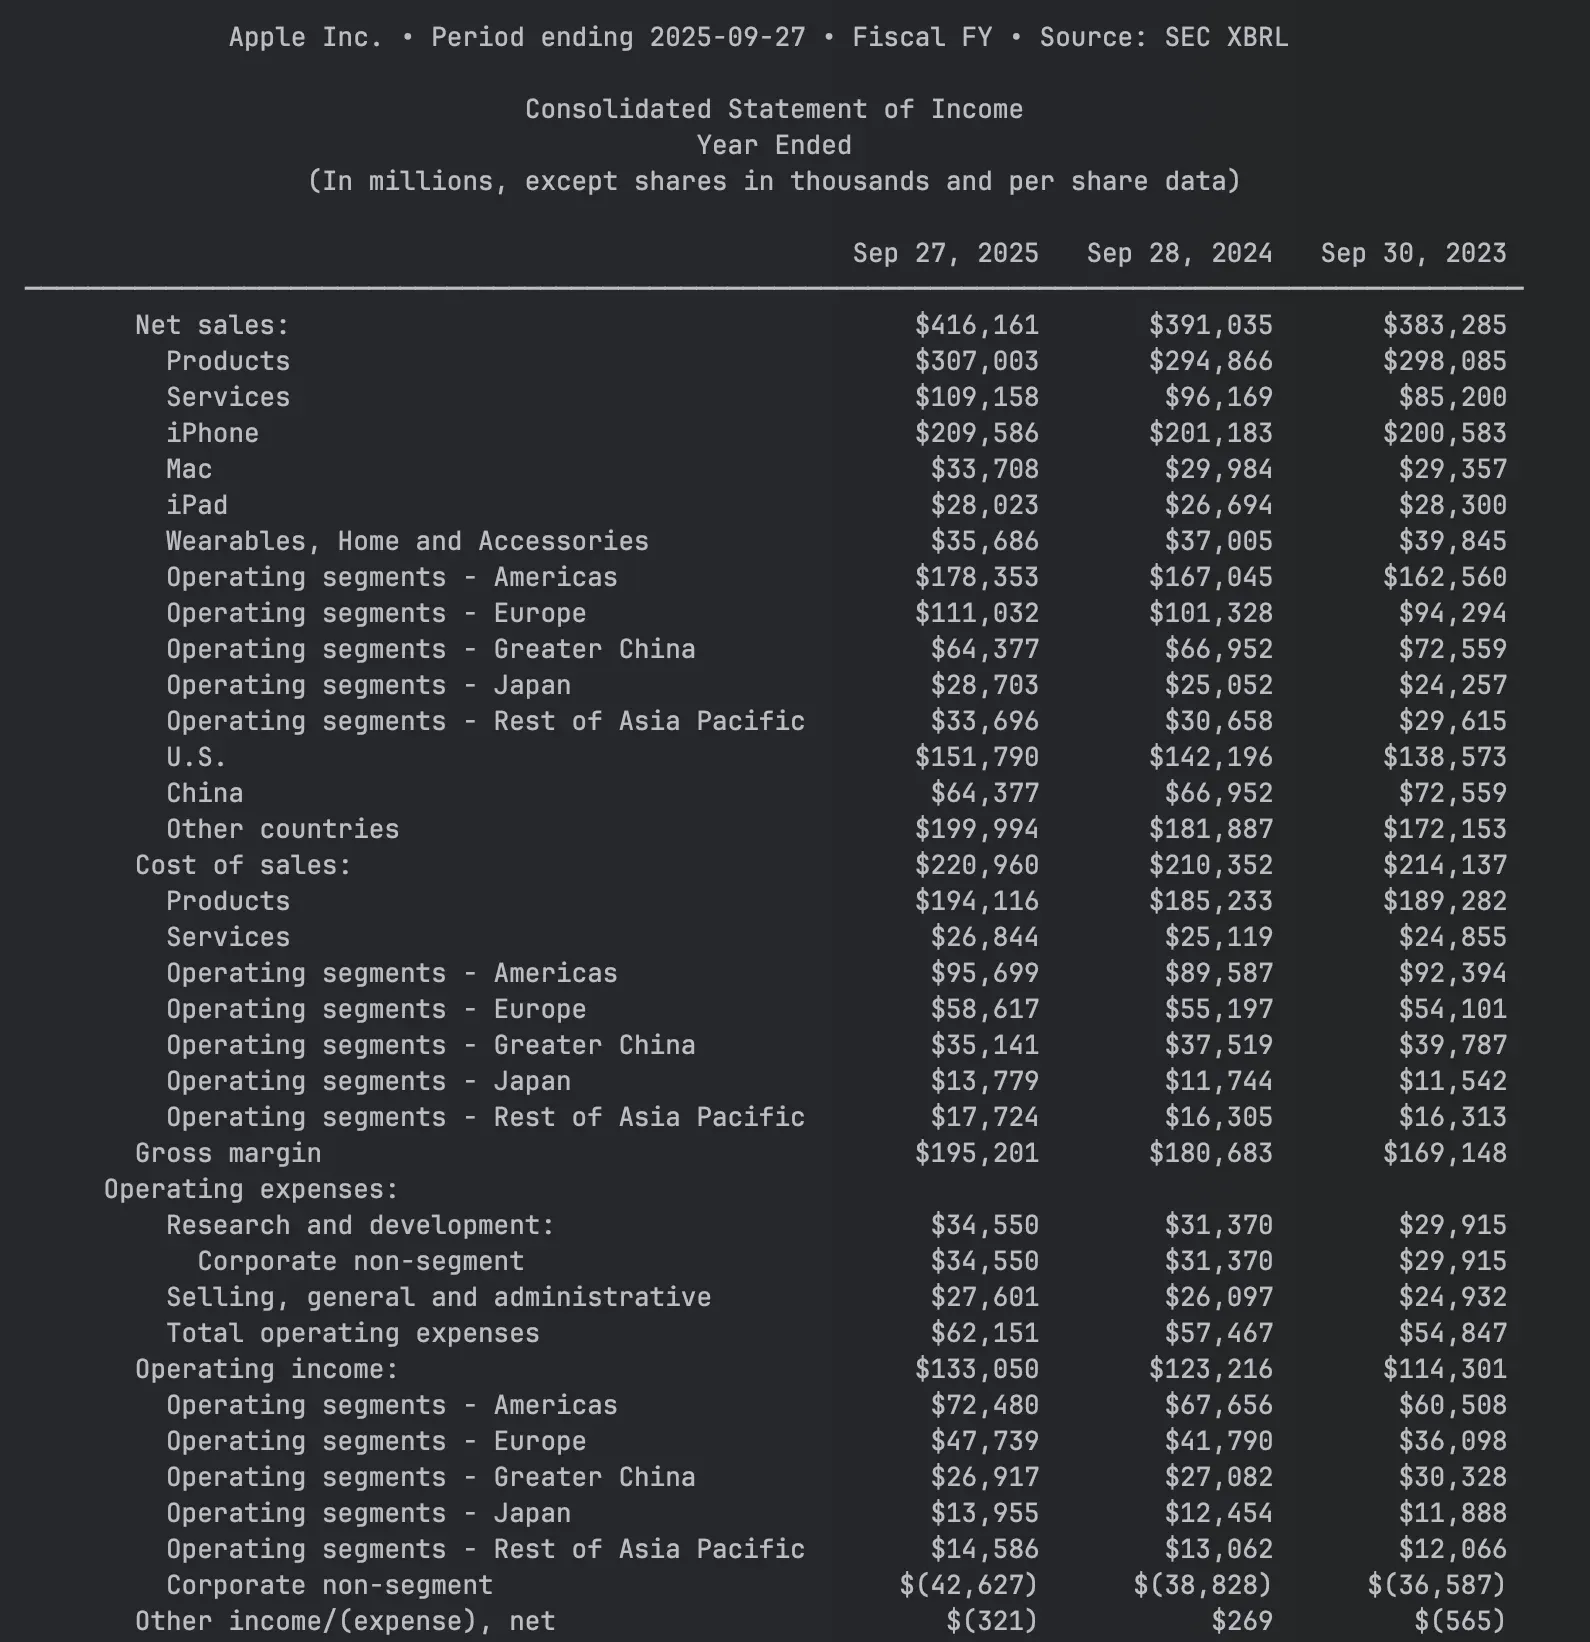
- summary — Just the totals. Hides all dimensional rows entirely, giving you a clean overview of the main line items. Useful when you want the big picture without any sub-breakdowns.
# Summary view - totals only, no dimensional detail
balance_sheet.get_statement(view="summary")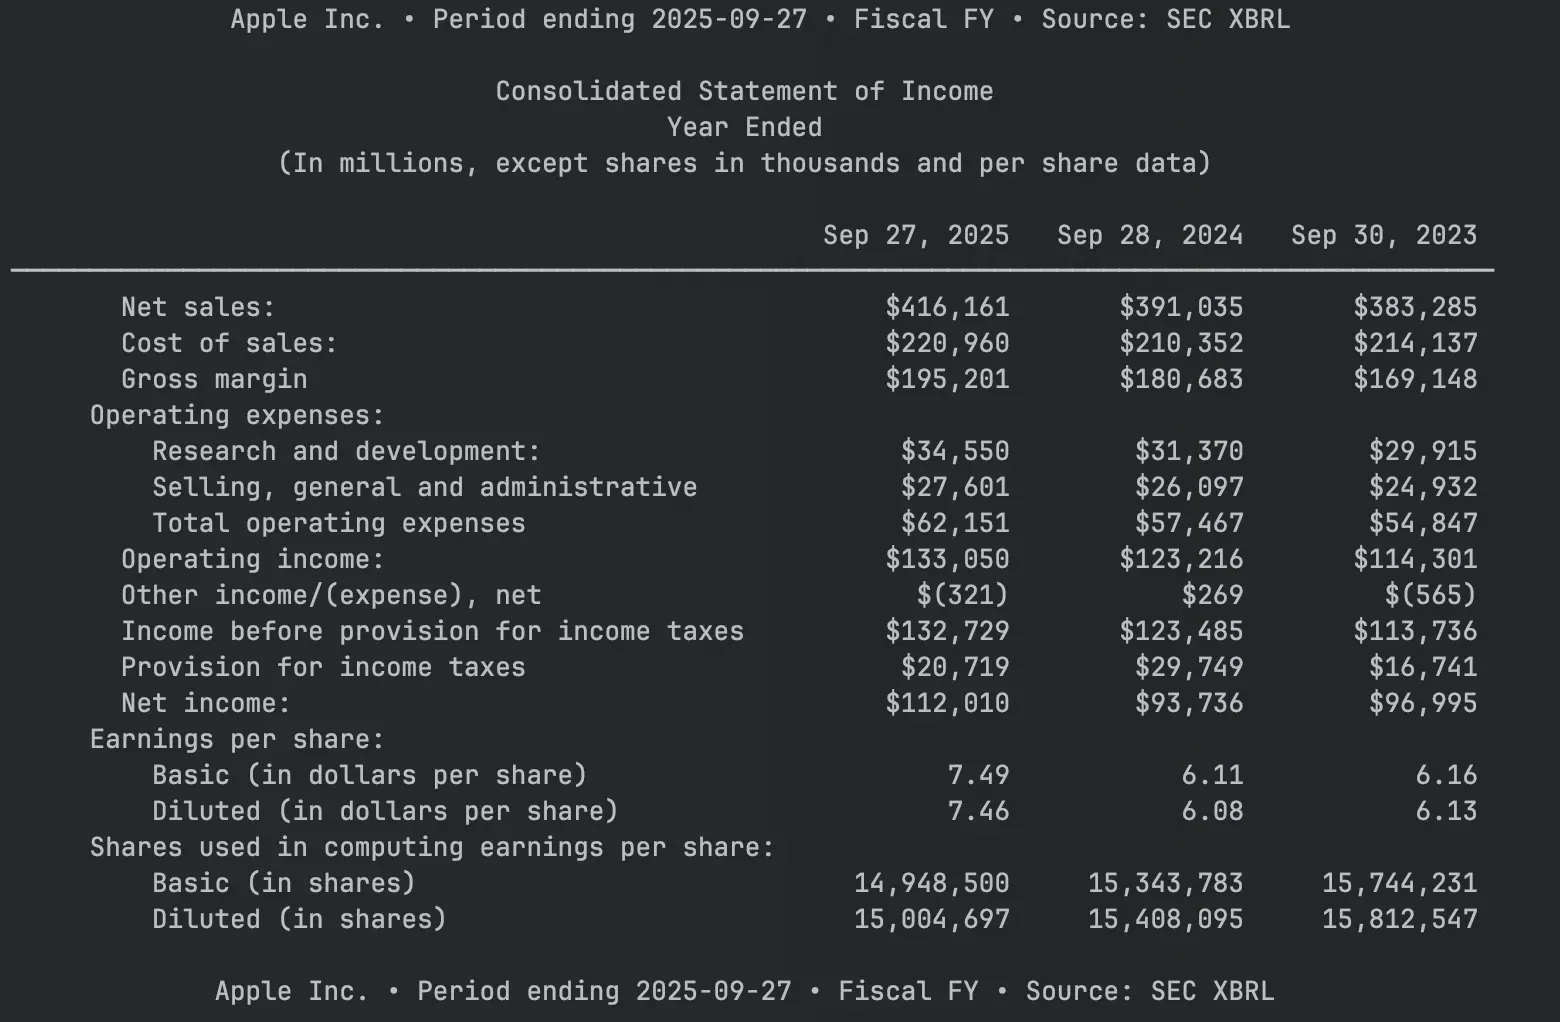
Conclusion
This article outlined the changes in XBRL financials in edgartools between 5.7.0 and 5.8.x. These were large quality of life improvements and you can rely on more accuracy and more flexibility in getting the data how you want it. More changes are in the pipeline - among them Context Aware Standardization - which promises the ability to align statements across different companies.
You can checkout the new features by installing the latest version of edgartools using pip install edgartools. You can also head over to the Github Repo and leave a comment or a star.