Building a BDC early warning system in Python
How to detect BDC distress signals in SEC filings using Python. PIK income ratios, NAV declines, and dividend coverage from XBRL data predicted FSK and TCPC collapses years early. Includes a reusable scanner built with edgartools

In February 2025, BlackRock TCP Capital filed its annual 10-K with the SEC. Buried in the tax footnote was a single number: $489 million in gross unrealized depreciation, 62% of the fund's entire net asset value. One line of Python surfaces it:
from edgar import Company

facts = Company("TCPC").get_facts()
(facts
.time_series("us-gaap:TaxBasisOfInvestmentsGrossUnrealizedDepreciation")
)
That number told you everything you needed to know. Over the next twelve months, TCPC's NAV fell from $9.23 to $7.07, the dividend was cut 32%, and cumulative investment losses reached $7.80 per share, more than the company's entire book value.
The financial press treated the Q4 2025 decline as a surprise but it shouldn't have been. The filing had the answer.
TCPC isn't alone. Private credit defaults have hit a record 5.8%. Only 5 of 46 BDCs trade above net asset value. Blue Owl permanently closed redemption gates on a $1.6 billion fund. The BDC sector is having a difficult year, but every one of these outcomes left a trail in the SEC filings, visible quarters or years before the headlines caught up.
This post follows that trail. We'll walk through two case studies using real XBRL data pulled with edgartools, identify the specific signals that matter, and build a reusable early warning scanner you can run against any BDC today.
What Is a BDC?
A Business Development Company (BDC) is a publicly traded fund that lends to middle-market companies, typically private businesses too small for the bond market. BDCs are required to distribute at least 90% of taxable income as dividends, which makes them popular with income investors.
They're also required to file detailed financial reports with the SEC, including schedules of every portfolio investment, quarterly NAV calculations, and XBRL-tagged financial data. That reporting requirement is what makes BDCs uniquely analyzable with tools like edgartools: the raw data is public, structured, and machine-readable.
How PIK Income Signals BDC Distress
When a borrower can't pay cash interest on a loan, the lender sometimes agrees to accept more debt instead: the interest gets added to the principal. This is called Payment-In-Kind, or PIK. The borrower's debt grows and the lender books "income" that never arrived as cash.
For a BDC, rising PIK income is the earliest warning sign worth watching. It means the portfolio companies are struggling to service their debt. The income statement still looks healthy until you check how much of that income is paper.
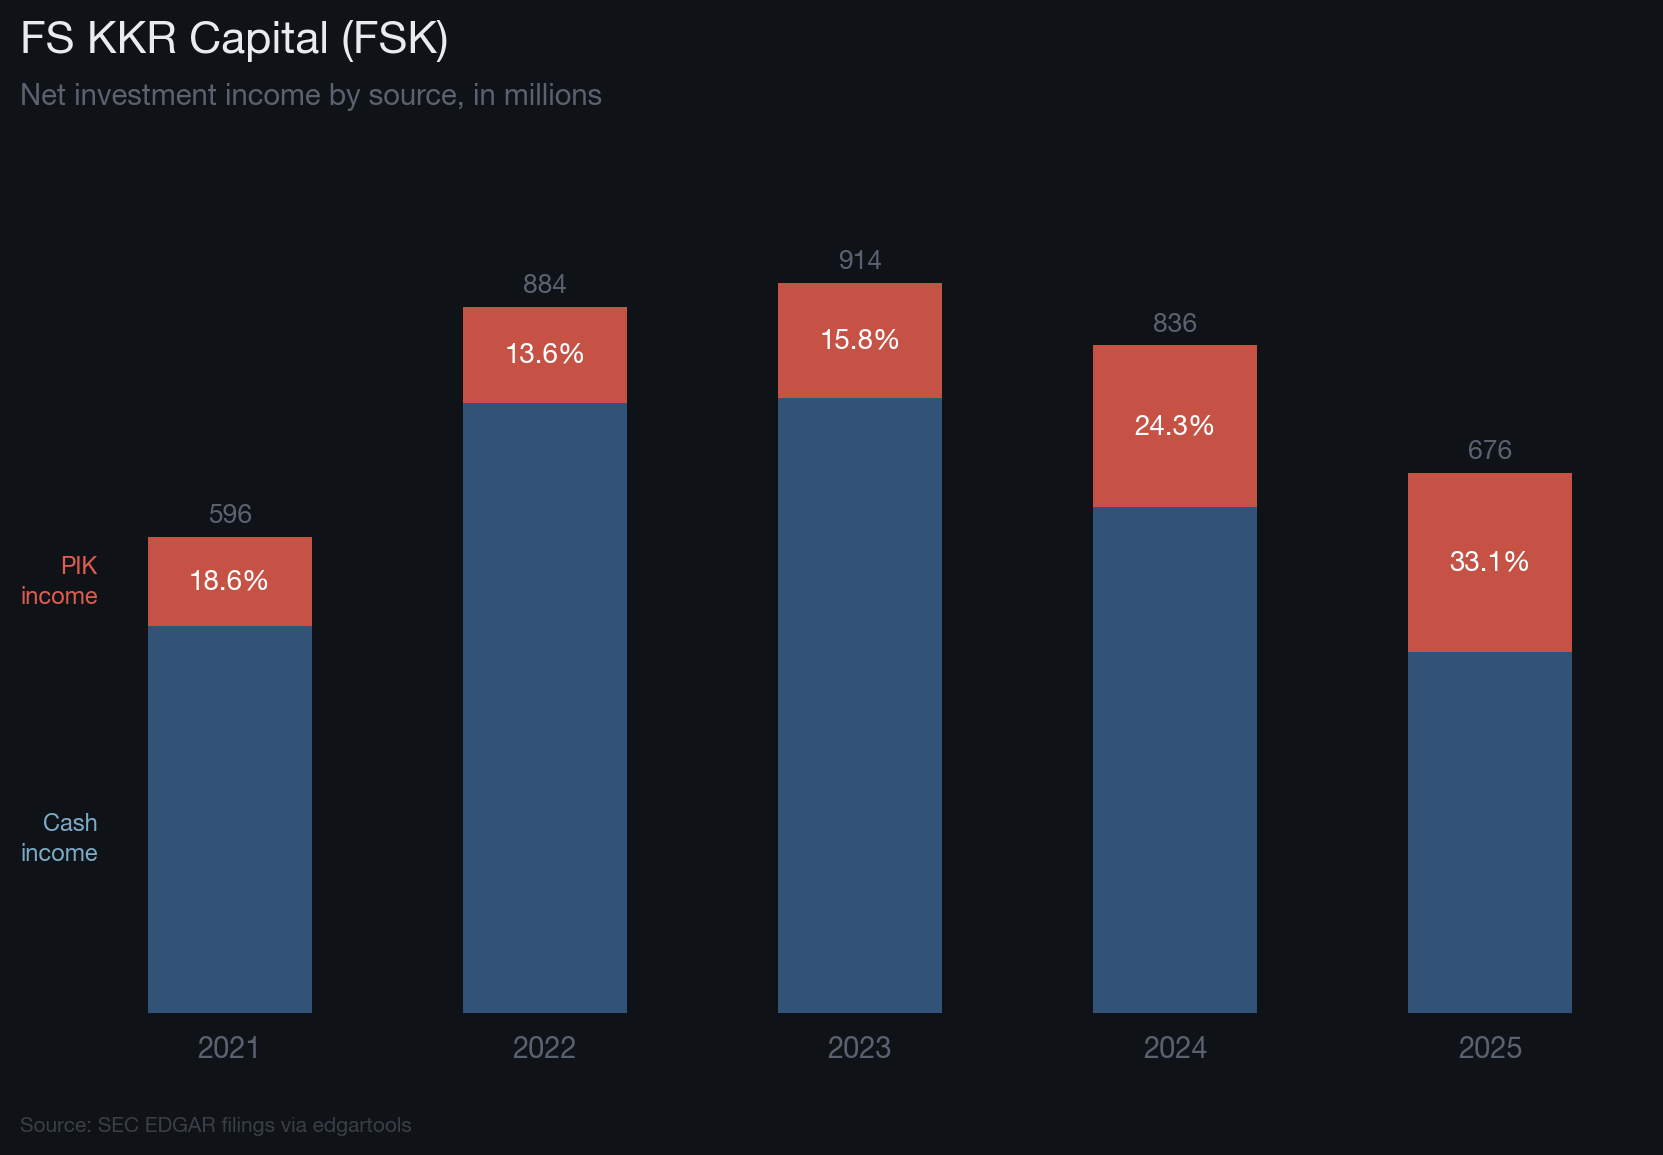
FS KKR Capital (FSK) is a good place to start. Here's what the filings showed:
| Fiscal Year | PIK Income | Net Investment Income | PIK as % of NII |
|---|---|---|---|
| 2021 | $111M | $596M | 18.6% |
| 2022 | $120M | $884M | 13.6% |
| 2023 | $144M | $914M | 15.8% |
| 2024 | $203M | $836M | 24.3% |
| 2025 | $224M | $676M | 33.1% |
By 2025, one-third of all reported income was IOUs. Net investment income was falling while PIK was rising, the kind of divergence that's hard to explain away.
The code to pull this from SEC filings:
from edgar import Company
import pandas as pd

company = Company("FSK")
facts = company.get_facts()

# PIK income — borrowers paying with more debt instead of cash
pik = facts.time_series("us-gaap:InterestIncomeOperatingPaidInKind")
nii = facts.time_series("us-gaap:NetInvestmentIncome")

# Get annual figures
pik_annual = pik[pik["fiscal_period"] == "FY"].sort_values("period_end")
nii_annual = nii[nii["fiscal_period"] == "FY"].sort_values("period_end")

# Merge and compute PIK ratio
merged = pd.merge(
    pik_annual[["period_end", "numeric_value"]].rename(columns={"numeric_value": "pik"}),
    nii_annual[["period_end", "numeric_value"]].rename(columns={"numeric_value": "nii"}),
    on="period_end"
)
merged["pik_pct"] = (merged["pik"] / merged["nii"] * 100).round(1)
print(merged[["period_end", "pik", "nii", "pik_pct"]].to_string(index=False))
There's a second signal in the same filings. Dividend coverage (net investment income per share divided by dividend per share) is straightforward math. When it drops below 100%, the BDC is paying out more than it earns:
| Fiscal Year | NII/Share | Dividend/Share | Coverage |
|---|---|---|---|
| 2023 | $3.18 | $2.95 | 107.8% |
| 2024 | $2.90 | $2.90 | 100.0% |
| 2025 | $2.34 | $2.80 | 83.6% |
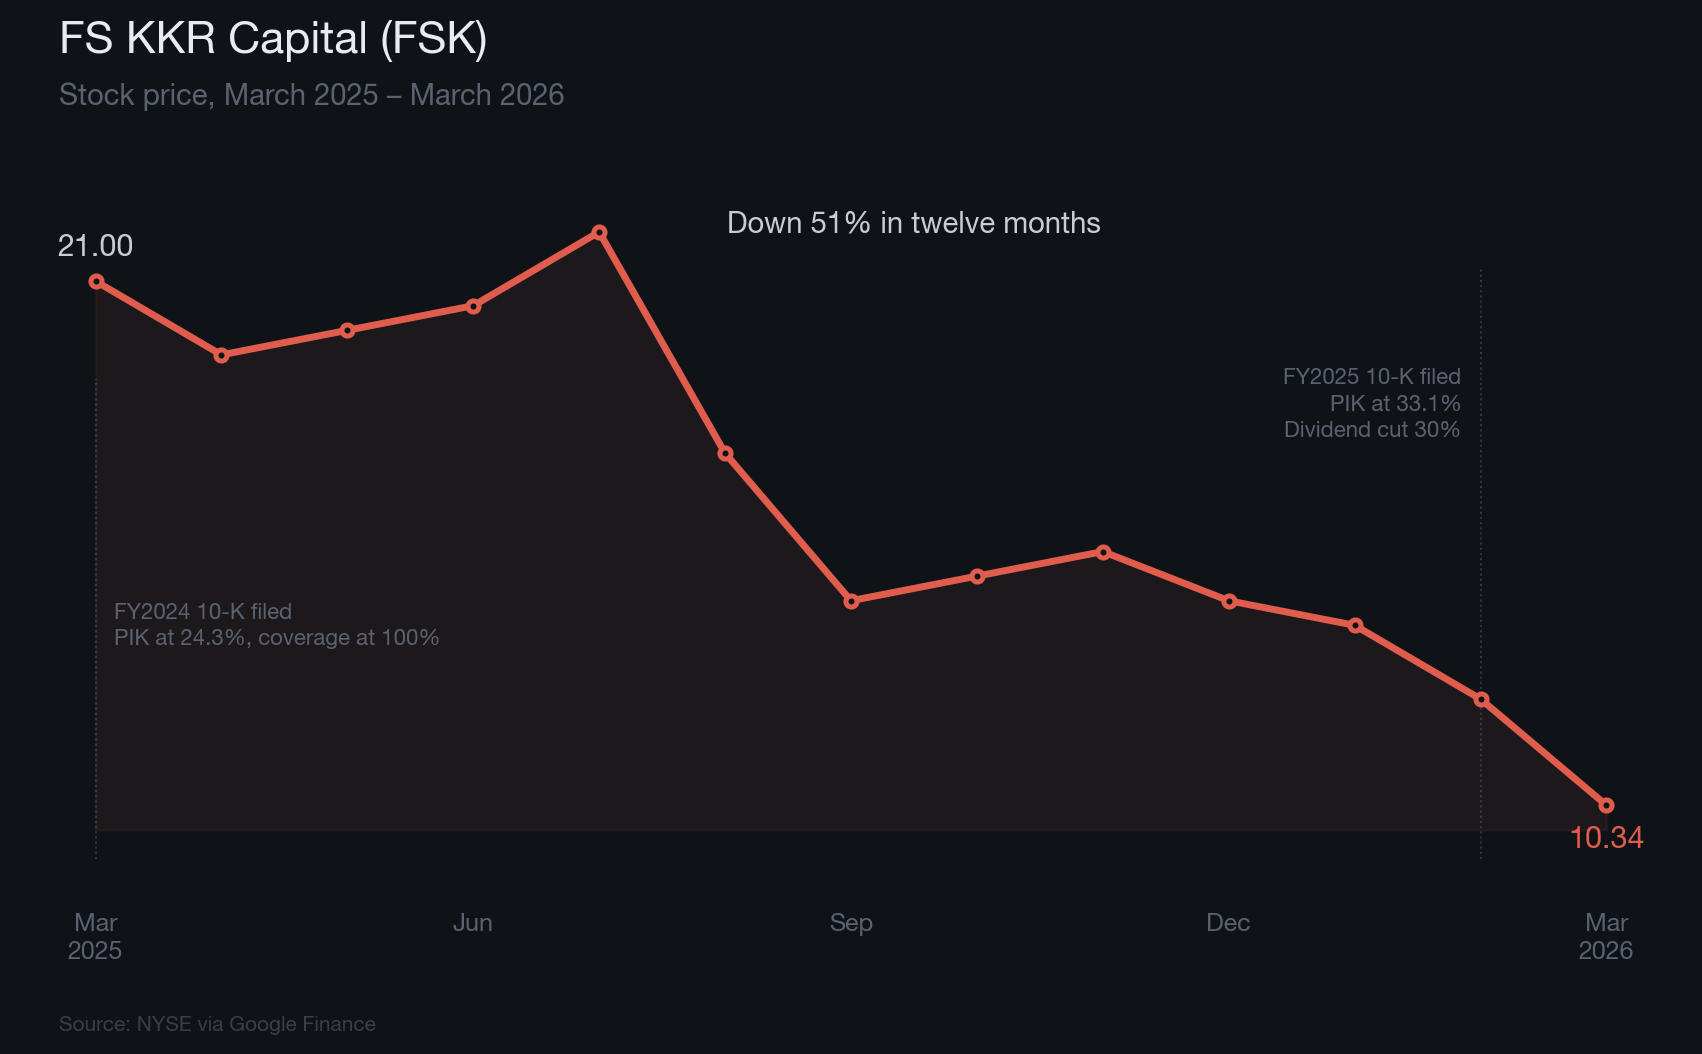
In FY2024, FSK's coverage hit exactly 100.0%: NII per share of $2.90 against dividends of $2.90. No margin at all. The math said the cut was coming. The next year, coverage fell to 83.6%, and FSK cut its dividend by 30%.
Both signals (rising PIK, thinning coverage) were visible in every annual filing for years before the cut. The stock was at $21 when the FY2024 10-K showed coverage at exactly 100%. Twelve months later, it was at $10.34.
These are what we'll call Tier 1 indicators: leading signals you can act on before the damage is done.
TCPC Case Study: When Every BDC Metric Moves Together
FSK's decline was gradual: a slow deterioration across one or two signals. BlackRock TCP Capital (TCPC) was different: every metric went in the same direction at the same time.
Start with NAV. TCPC reported declining net asset value per share for ten consecutive quarters:
| Quarter | NAV/Share | Change from Peak |
|---|---|---|
| 2021-Q4 | $14.36 | Peak |
| 2022-Q4 | $12.93 | -10.0% |
| 2023-Q4 | $11.90 | -17.1% |
| 2024-Q1 | $11.14 | -22.4% |
| 2024-Q2 | $10.20 | -29.0% |
| 2024-Q3 | $10.11 | -29.6% |
| 2024-Q4 | $9.23 | -35.7% |
| 2025-Q2 | $8.71 | -39.3% |
| 2025-Q3 | $8.71 | -39.3% |
| 2025-Q4 | $7.07 | -50.8% |
from edgar import Company

facts = Company("TCPC").get_facts()
nav = facts.time_series("us-gaap:NetAssetValuePerShare")
nav = nav.drop_duplicates(subset=["period_end"]).sort_values("period_end")
print(nav[["period_end", "numeric_value"]].tail(12).to_string(index=False))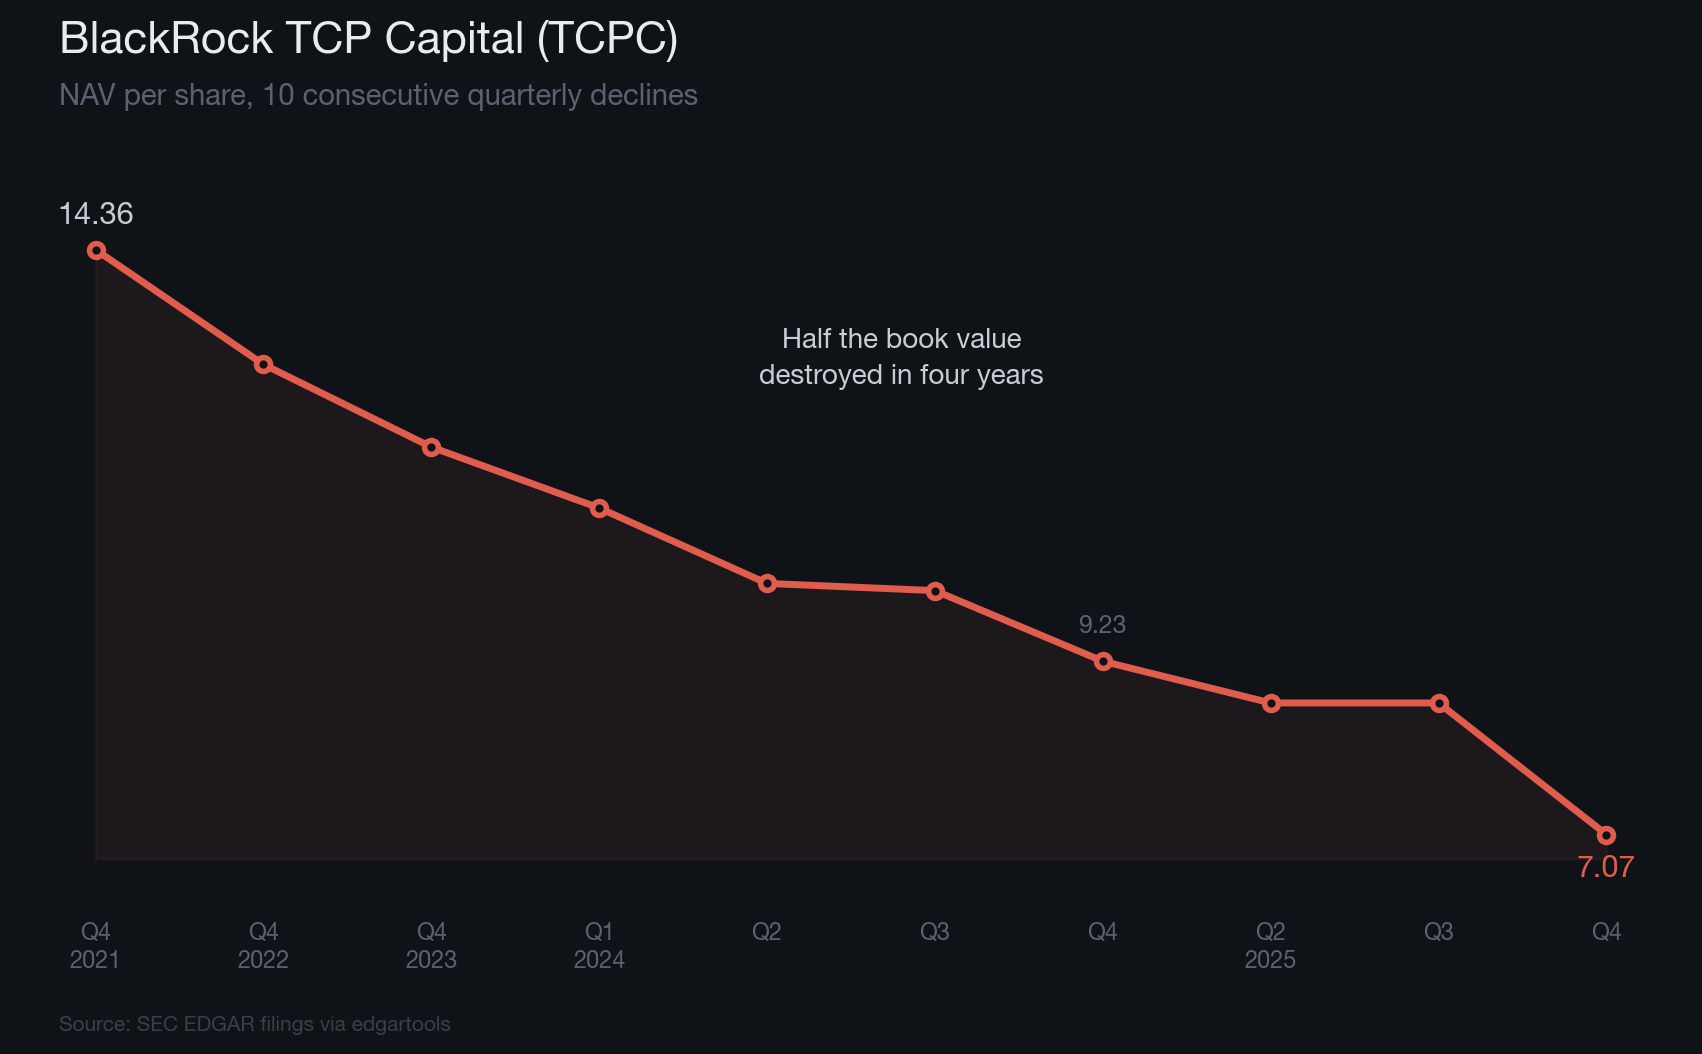
A declining NAV isn't unusual on its own; BDCs are sensitive to credit cycles. What made TCPC worth watching was what the other metrics showed at the same time.
Unrealized depreciation surged. The gross unrealized depreciation on TCPC's investments (how much the portfolio had dropped below cost) went from $143M to $489M in a single year. As a percentage of net assets, it jumped from 21% to 62%:
| Year End | Gross Unrealized Depreciation | % of Net Assets |
|---|---|---|
| 2021 | $96M | — |
| 2022 | $147M | 19.7% |
| 2023 | $143M | 20.7% |
| 2024 | $489M | 62.3% |
| 2025 | $444M | 74.2% |
from edgar import Company
import pandas as pd

facts = Company("TCPC").get_facts()
depreciation = facts.time_series("us-gaap:TaxBasisOfInvestmentsGrossUnrealizedDepreciation")
net_assets = facts.time_series("us-gaap:AssetsNet")

dep_annual = depreciation[depreciation["fiscal_period"] == "FY"].drop_duplicates("period_end").sort_values("period_end")
nav_annual = net_assets[net_assets["fiscal_period"] == "FY"].drop_duplicates("period_end").sort_values("period_end")

merged = pd.merge(
    dep_annual[["period_end", "numeric_value"]].rename(columns={"numeric_value": "depreciation"}),
    nav_annual[["period_end", "numeric_value"]].rename(columns={"numeric_value": "net_assets"}),
    on="period_end"
)
merged["pct_of_nav"] = (merged["depreciation"] / merged["net_assets"] * 100).round(1)
print(merged.to_string(index=False))
Realized losses grew 4x in a single year. As investments were written off, realized losses went from $67M (FY2024) to $278M (FY2025). The quarterly filings showed this in real time. By Q1 2025, one quarter already accounted for 61% of the prior full year's losses.
Cumulative losses exceeded book value. TCPC's total gain/loss per share across FY2022–FY2025 was $-7.80. The company's NAV at year-end 2025 was $7.07 .The investments had lost more than the company was worth.
For contrast, consider Main Street Capital (MAIN) over the same period. Non-accruals: 1% of fair value. NAV per share: up 5.3% in 2025. Portfolio: marked above cost. Dividend: increased 2%.
Same market. Same rate environment. Same asset class. The filings showed you which was which, in quantitative terms, well before the outcomes were clear.
These metrics — NAV trajectory, unrealized depreciation, realized loss acceleration, are Tier 2 and Tier 3 indicators: confirming signals that validate earlier warnings and lagging signals that quantify damage already done.
Private Credit Distress Across the BDC Sector
FSK and TCPC are instructive, but they're not isolated. The same patterns show up across the sector.
Part of the reason is structural. Roughly 25% of all private credit lending is to software companies, an industry built on assumptions of sticky recurring revenue, high margins, and predictable cash flows. AI is testing those assumptions. JPMorgan has marked down software company loans. UBS has floated a worst-case scenario of 15% default rates for software-heavy portfolios. BDC earnings calls in Q4 2025 almost universally addressed AI risk.
The filing data tells a consistent story:
Blue Owl Capital (OBDC) saw realized losses go from a +$4.1M gain in 2022 to a -$179.2M loss in FY2025, a steady progression visible in every quarterly filing. In February 2026, Blue Owl permanently closed redemption gates on its $1.6B OBDC II fund, which had seen its portfolio shrink 30% and NII fall 32% in three years. The filing data showed a fund in runoff mode well before the lockout.
Prospect Capital (PSEC), trading at a 46% discount to NAV, saw PIK income rise 60% in a single year($83M to $133M, FY2022 to FY2023). That increase came two full years before the worst NAV declines. Eight consecutive quarters of NAV erosion followed, with $449.8M in realized losses over the most recent two quarters.
Blackstone's $82B flagship private credit fund (BCRED) saw 7.9% redemption requests in Q1 2026, with $3.7B in gross withdrawals. Blackstone injected $400M into a feeder fund to meet them.
The numbers at the sector level: $12.7 billion in debt maturities in 2026, up 73% from 2025. The default rate has reached 5.8%, the highest since Proskauer began tracking. Only 5 of 46 BDCs trade at or above NAV.
The filings contain the same signals for all of them. The data is there for anyone who wants to look.
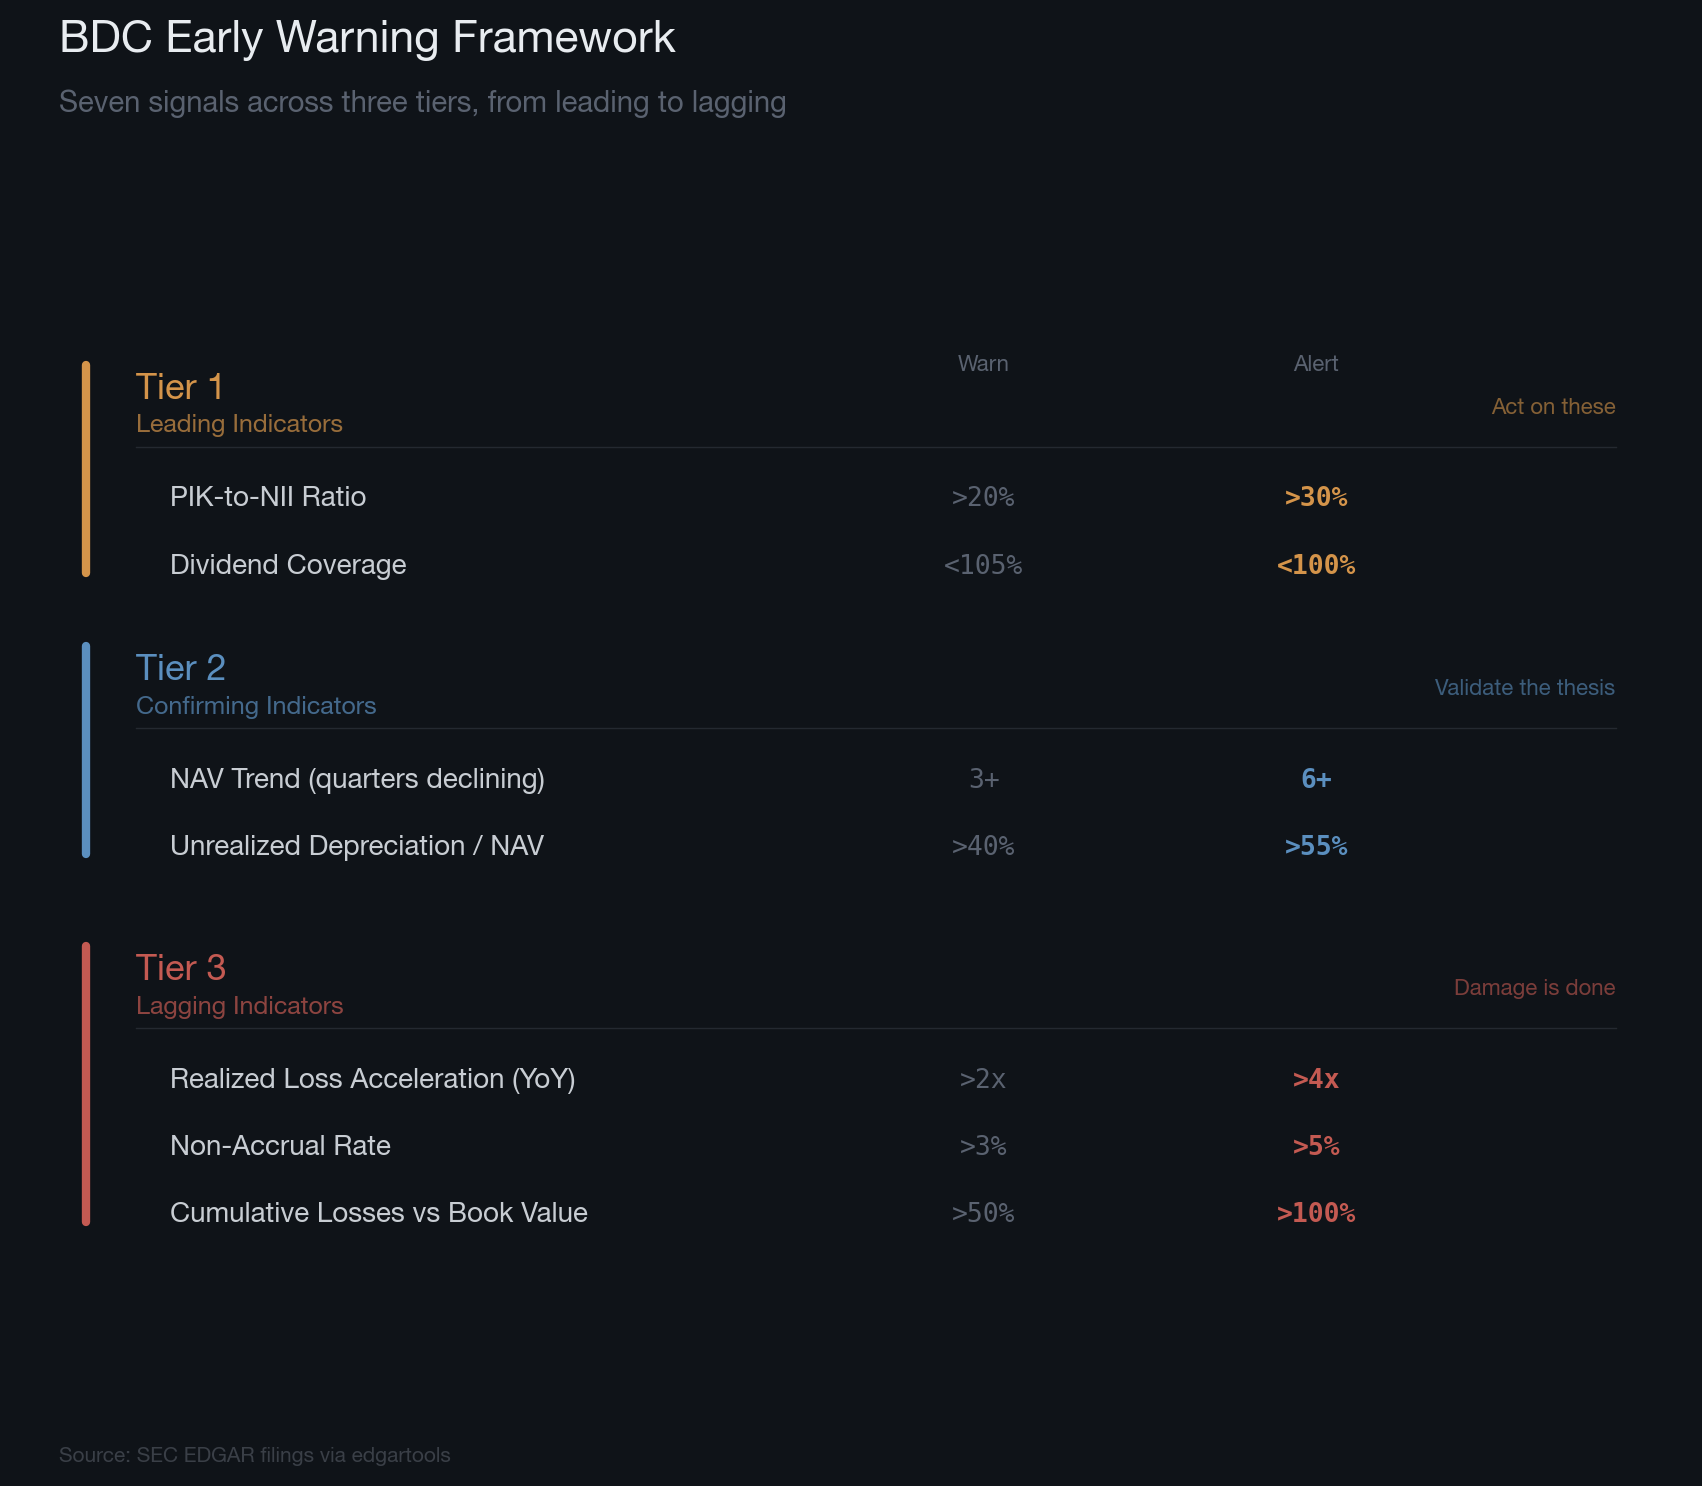
Seven Signals, Three Tiers
Every finding in this post traces back to a specific XBRL concept in SEC filings, a machine-readable field that edgartools can extract and track over time. Here they are, organized by how early they tend to appear:
Tier 1 — Leading Indicators
| Signal | XBRL Concept | Watch | Concern |
|---|---|---|---|
| PIK-to-NII ratio | InterestIncomeOperatingPaidInKind ÷ NetInvestmentIncome |
>20% | >30% |
| Dividend coverage | InvestmentCompanyInvestmentIncomeLossPerShare ÷ declared dividend |
<105% | <100% |
These show up first. FSK's PIK ratio crossed 20% in FY2024 — a full year before the dividend cut. Coverage at exactly 100.0% left no room for anything other than a cut.
Tier 2 — Confirming Indicators
| Signal | XBRL Concept | Watch | Concern |
|---|---|---|---|
| NAV trend | NetAssetValuePerShare (consecutive quarterly declines) |
3+ quarters | 6+ quarters |
| Unrealized depreciation / NAV | TaxBasisOfInvestmentsGrossUnrealizedDepreciation ÷ AssetsNet |
>40% | >55% |
TCPC's NAV declined for 10 straight quarters. Unrealized depreciation reached 62% of NAV. Either signal on its own is worth investigating; together, they tell a clear story.
Tier 3 — Lagging Indicators
| Signal | XBRL Concept | Watch | Concern |
|---|---|---|---|
| Realized loss acceleration | RealizedInvestmentGainsLosses (year-over-year growth) |
>2x prior year | >4x prior year |
| Non-accrual rate | Non-accrual loans ÷ total portfolio at fair value | >3% | >5% |
| Cumulative losses vs. book | InvestmentCompanyGainLossOnInvestmentPerShare (sum) vs. NAV/share |
>50% | >100% |
By the time Tier 3 signals appear, the market has usually noticed. But they're useful for distinguishing a bad quarter from a structural problem — TCPC's cumulative losses exceeding book value is not ambiguous.
Building a Scanner in Python
The framework is useful for manual analysis. Applied programmatically across all 46 BDCs, it becomes something more interesting. Here's the scanner:
from edgar import Company
import pandas as pd

def scan_bdc(ticker):
    """Scan a BDC's SEC filings for warning signals."""
    facts = Company(ticker).get_facts()
    signals = {}

    # Tier 1: PIK ratio
    pik = facts.time_series("us-gaap:InterestIncomeOperatingPaidInKind")
    nii = facts.time_series("us-gaap:NetInvestmentIncome")
    if pik is not None and nii is not None:
        pik_fy = pik[pik["fiscal_period"] == "FY"].sort_values("period_end")
        nii_fy = nii[nii["fiscal_period"] == "FY"].sort_values("period_end")
        if len(pik_fy) and len(nii_fy):
            ratio = float(pik_fy["numeric_value"].iloc[-1] / nii_fy["numeric_value"].iloc[-1])
            signals["pik_pct"] = round(ratio * 100, 1)

    # Tier 1: Dividend coverage
    nii_ps = facts.time_series("us-gaap:InvestmentCompanyInvestmentIncomeLossPerShare")
    div_ps = facts.time_series("us-gaap:CommonStockDividendsPerShareDeclared")
    if nii_ps is not None and div_ps is not None:
        nii_latest = nii_ps[nii_ps["fiscal_period"] == "FY"].sort_values("period_end")
        div_latest = div_ps[div_ps["fiscal_period"] == "FY"].sort_values("period_end")
        if len(nii_latest) and len(div_latest):
            coverage = float(nii_latest["numeric_value"].iloc[-1] / div_latest["numeric_value"].iloc[-1])
            signals["div_coverage"] = round(coverage * 100, 1)

    # Tier 2: Consecutive NAV declines
    nav = facts.time_series("us-gaap:NetAssetValuePerShare")
    if nav is not None:
        quarterly = nav.drop_duplicates("period_end").sort_values("period_end")
        vals = quarterly["numeric_value"].tail(8).tolist()
        declines = sum(1 for i in range(1, len(vals)) if vals[i] < vals[i - 1])
        signals["nav_declines"] = declines

    # Tier 2: Unrealized depreciation / NAV
    dep = facts.time_series("us-gaap:TaxBasisOfInvestmentsGrossUnrealizedDepreciation")
    assets = facts.time_series("us-gaap:AssetsNet")
    if dep is not None and assets is not None:
        dep_fy = dep[dep["fiscal_period"] == "FY"].sort_values("period_end")
        assets_fy = assets[assets["fiscal_period"] == "FY"].sort_values("period_end")
        if len(dep_fy) and len(assets_fy):
            ratio = float(dep_fy["numeric_value"].iloc[-1] / assets_fy["numeric_value"].iloc[-1])
            signals["deprec_pct_nav"] = round(ratio * 100, 1)

    return signals


# Scan the BDCs from this post
for ticker in ["FSK", "TCPC", "PSEC", "OBDC", "MAIN"]:
    result = scan_bdc(ticker)
    print(f"\n{ticker}: {result}")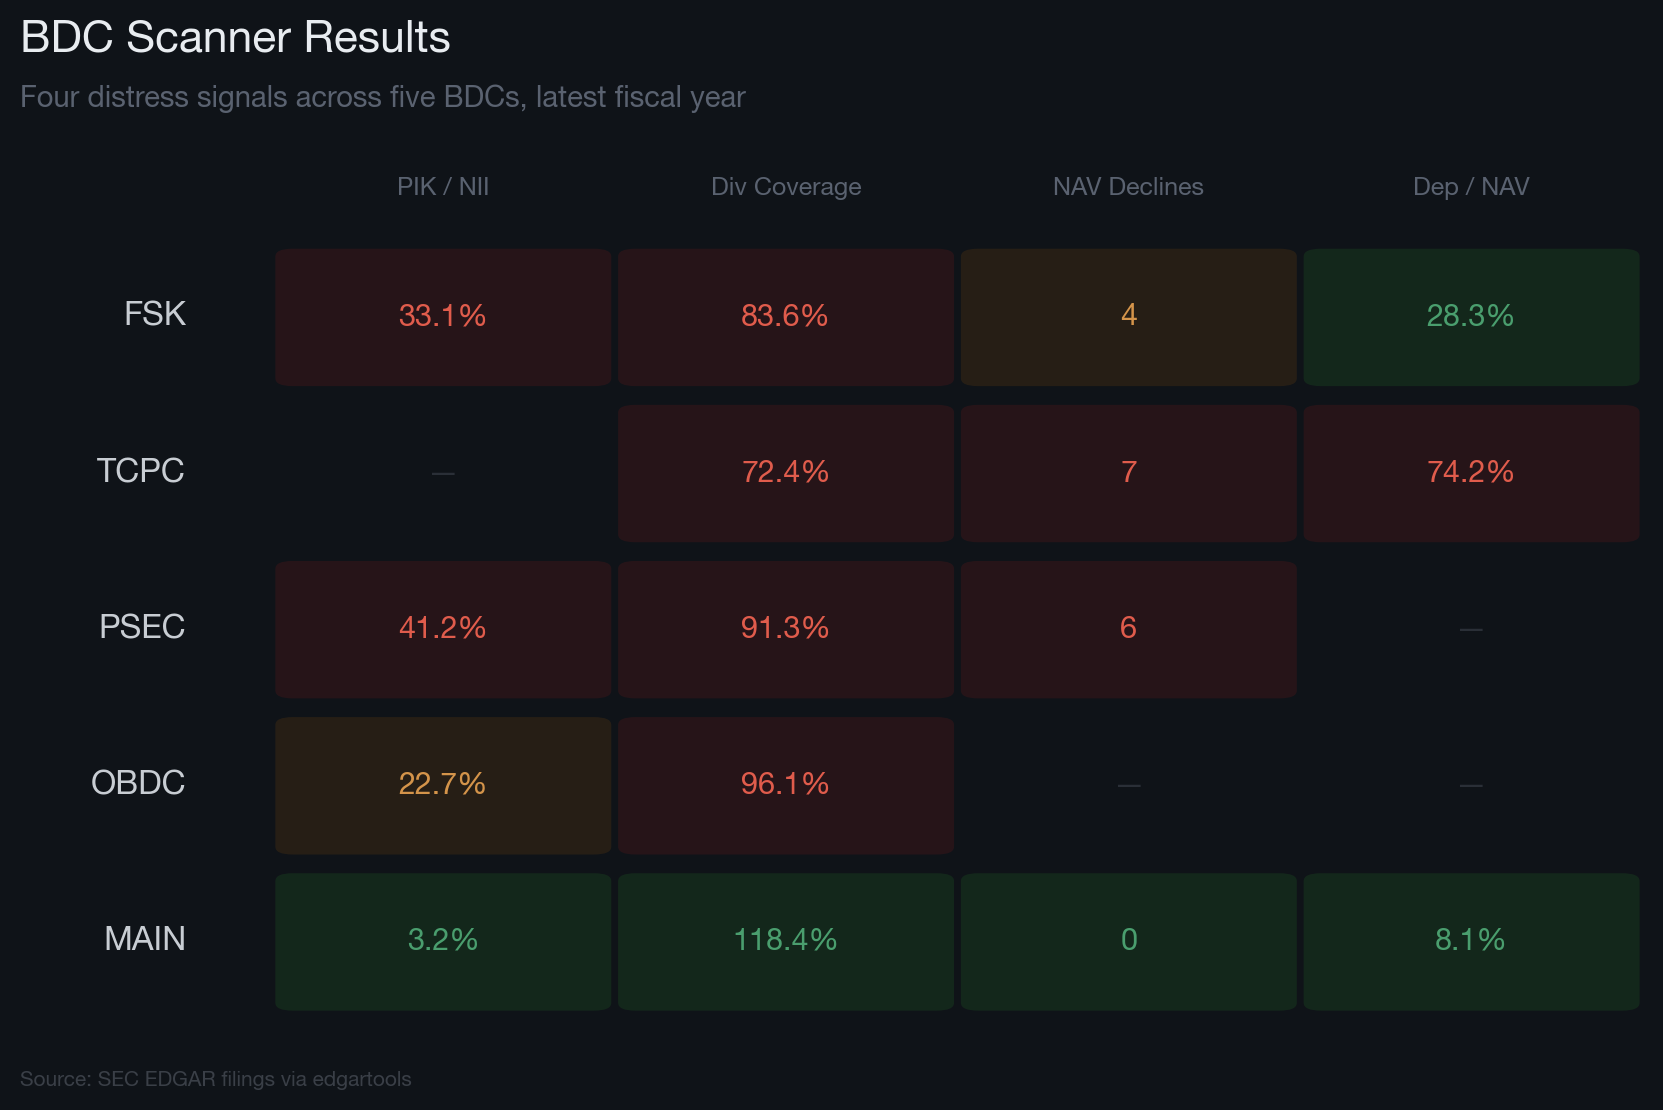
MAIN comes back clean across every signal. FSK and TCPC do not. The contrast — from the same code, the same data source — is the point.
For broader coverage, you can combine this with the BDC module's bulk dataset, which pulls the SEC's pre-extracted Schedule of Investments data for every BDC in a single call:
from edgar.bdc import get_bdc_list, fetch_bdc_dataset

# Every BDC the SEC tracks
bdcs = get_bdc_list()
print(f"BDCs in SEC registry: {len(bdcs)}")

# 100,000+ portfolio line items across all BDCs, one call
dataset = fetch_bdc_dataset(2024, 4)

# Which portfolio companies are held by the most BDCs?
soi = dataset.schedule_of_investments
top = soi.top_companies(25)
print(top)
When multiple BDCs hold the same portfolio company, a default at that company affects them all. The bulk dataset shows which names are the most widely held — a useful map of concentration risk that would be difficult to build by reading filings one at a time.
What's Next
There are 46 active BDCs filing with the SEC. Each one publishes quarterly and annual reports containing the same XBRL data fields used in this post. PIK ratios, NAV trajectories, unrealized depreciation, dividend coverage: all machine-readable, updated every quarter.
The private credit sector faces $12.7 billion in debt maturities this year. Default rates are at record highs. The filings being published right now contain the same signals.
Every filing tells a story. The tools to read it are available.
If you're new to BDC data in edgartools, start with the first post in this series. It covers the edgar.bdc module basics: finding BDCs, accessing portfolio investments, and filtering by investment type. For analyzing other filing types, see How to Parse SEC 424B Prospectus Filings with Python.
You can also explore BDC filings interactively on edgar.tools, which provides a web interface for browsing SEC filings, company financials, and XBRL data without writing code.
Frequently Asked Questions
How do you detect BDC distress signals in SEC filings?
BDC distress signals are embedded in XBRL-tagged financial data within 10-K and 10-Q filings. The most reliable leading indicators are the PIK-to-NII ratio (Payment-In-Kind income as a percentage of Net Investment Income) and dividend coverage (NII per share divided by declared dividends per share). When PIK exceeds 20% of NII or dividend coverage drops below 105%, the BDC warrants closer investigation. These fields can be extracted programmatically using Python libraries like edgartools.
What is PIK income and why does it matter for BDC investors?
PIK (Payment-In-Kind) income is interest that a borrower pays not in cash but by adding more debt to the loan principal. For a BDC, rising PIK means portfolio companies are struggling to service their debt with cash. The income still appears on the income statement, but none of it arrived as cash. FS KKR Capital's PIK ratio rose from 18.6% in 2021 to 33.1% in 2025, a clear warning sign that preceded a 30% dividend cut and a stock price decline from $21 to $10.34.
What XBRL concepts are used to analyze BDC health?
The key XBRL concepts for BDC analysis include: InterestIncomeOperatingPaidInKind (PIK income), NetInvestmentIncome (total NII), NetAssetValuePerShare (NAV per share), TaxBasisOfInvestmentsGrossUnrealizedDepreciation (unrealized portfolio losses), AssetsNet (total net assets), RealizedInvestmentGainsLosses (realized gains/losses), and InvestmentCompanyGainLossOnInvestmentPerShare (cumulative gain/loss per share). All are available through SEC EDGAR's XBRL data and can be queried with edgartools' get_facts() and time_series() methods.
How many BDCs are currently trading below NAV?
As of early 2026, only 5 of 46 active BDCs trade at or above net asset value. Private credit default rates have reached 5.8% (the highest since Proskauer began tracking), and the sector faces $12.7 billion in debt maturities in 2026, up 73% from 2025.
Can I scan all BDCs for warning signals at once?
Yes. The scan_bdc() function in this post checks PIK ratios, dividend coverage, NAV decline streaks, and unrealized depreciation for any ticker. Combined with edgartools' get_bdc_list() and fetch_bdc_dataset() functions, you can scan every SEC-registered BDC in a single script. The bulk dataset contains 100,000+ portfolio line items across all BDCs, enabling cross-fund concentration analysis.
EdgarTools is an open-source Python library for working with SEC EDGAR data. Used by financial analysts, quant researchers, and compliance teams to extract structured data from SEC filings.
pip install edgartools. Documentation · PyPI · GitHub